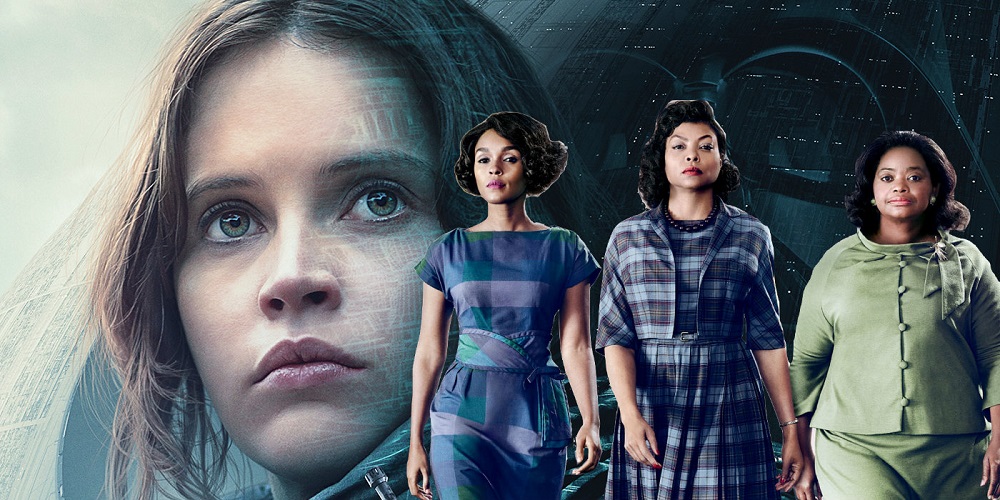
It was a tight race for “Hidden Figures” and “Rogue One: A Star Wars Story” on Sunday, but once the actual box office numbers came in on Monday, the Taraji P. Henson film unseated the spinoff.
With an ongoing taste for space, moviegoers propelled the NASA drama “Hidden Figures” past “Rogue One: A Star Wars Story” at the box office.
“Hidden Figures,” which tells the true story of three black female mathematicians integral to the early success of the American space program, sold $22.8 million in tickets over the weekend, enough to knock “Rogue One” from the top spot it held for three weeks.
The “Star Wars” spinoff finished second with $22 million, according to studio tallies released Monday.
“Hidden Figures” opened in limited release over Christmas, but it found its first big chance to reach audiences when it expanded by more than 2,400 locations Friday.
The top 20 movies at U.S. and Canadian theaters Friday through Sunday, followed by distribution studio, gross, number of theater locations, average receipts per location, total gross and number of weeks in release, as compiled Monday by comScore:
- “Hidden Figures,” 20th Century Fox, $22,800,057, 2,471 locations, $9,227 average, $25,754,235, 3 weeks.
- “Rogue One: A Star Wars Story,” Disney, $22,063,570, 4,157 locations, $5,308 average, $477,364,924, 4 weeks.
- “Sing,” Universal, $20,712,365, 3,955 locations, $5,237 average, $214,512,010, 3 weeks.
- “Underworld: Blood Wars,” Sony, $13,688,751, 3,070 locations, $4,459 average, $13,688,751, 1 week.
- “La La Land,” Lionsgate, $10,132,213, 1,515 locations, $6,688 average, $51,788,800, 5 weeks.
- “Passengers,” Sony, $8,816,213, 3,400 locations, $2,593 average, $80,909,256, 3 weeks.
- “Why Him?” 20th Century Fox, $6,901,730, 2,904 locations, $2,377 average, $48,961,283, 3 weeks.
- “Moana,” Disney, $6,384,485, 2,549 locations, $2,505 average, $225,365,667, 7 weeks.
- “Fences,” Paramount, $4,813,606, 2,368 locations, $2,033 average, $40,776,870, 4 weeks.
- “Assassin’s Creed,” 20th Century Fox, $4,178,643, 2,642 locations, $1,582 average, $49,884,426, 3 weeks.
- “Manchester By The Sea,” Roadside Attractions, $2,517,794, 1,057 locations, $2,382 average, $33,858,151, 8 weeks.
- “A Monster Calls,” Focus Features, $2,080,051, 1,523 locations, $1,366 average, $2,171,543, 3 weeks.
- “Lion,” The Weinstein Company, $2,073,433, 600 locations, $3,456 average, $9,866,152, 7 weeks.
- “MET Opera: Nabucco (2017),” Fathom Events, $1,940,000, 900 locations, $2,156 average, $1,940,000, 1 week.
- “Fantastic Beasts And Where To Find Them,” Warner Bros., $1,923,459, 1,188 locations, $1,619 average, $229,180,032, 8 weeks.
- “Collateral Beauty,” Warner Bros., $1,291,048, 1,402 locations, $921 average, $29,846,313, 4 weeks.
- “Jackie,” Fox Searchlight, $1,048,643, 353 locations, $2,971 average, $9,245,194, 6 weeks.
- “Arrival,” Paramount, $865,796, 381 locations, $2,272 average, $94,128,318, 9 weeks.
- “Dangal,” UTV Communications, $807,311, 237 locations, $3,406 average, $11,151,900, 3 weeks.
- “Office Christmas Party,” Paramount, $802,911, 953 locations, $843 average, $54,065,262, 5 weeks.

